


In an increasingly digital world, the need for mobile connectivity and access has become more and more significant. Countries with higher rates of internet access typically benefit from improved economic outcomes, connectivity lends itself to increased productivity of companies and workers, increased access to markets and products on a global scale, as well as people’s access to upskilling, and by extension improved knowledge and productivity. As such, the race is on for countries to develop their infrastructure for connectivity, and to close the gap between themselves and others at the forefront of this progression.
As such, Distrelec has directly compared growth in connectivity between 2014 and 2021 between the changes to GDP per capita in that period of time, in order to see where increases in connectivity have had the greatest economic impact, and where the race could be on to close the gap. The study measures four enablers: infrastructure, affordability, consumer readiness, and content and services. This is assessed across various indicators like 4G and 5G coverage, mobile download speeds, upload speeds, servers per population, access to electricity, mobile ownership, apps developed per person, and the number of apps in the national language.
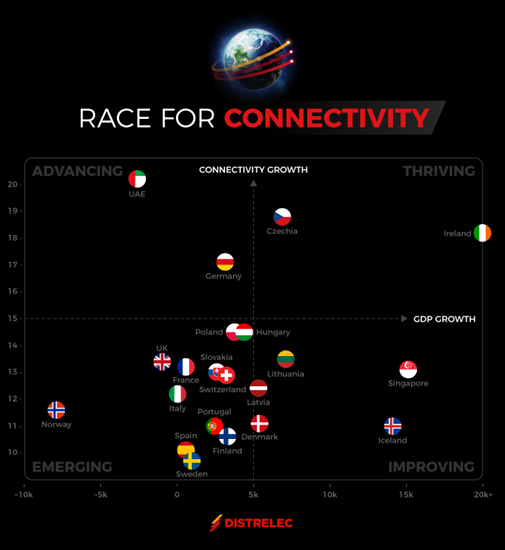
Which countries ranked highest for growth in connectivity between 2014 and 2021?
Ranking highest for the most significant growth in connectivity is the United Arab Emirates. The country saw a 20.2-point growth from 2014 to 2021 according to data we examined, beginning at a score of 64.6, and increasing to 84.4. This turn can be somewhat attributed to the 2017 Strategy for the Fourth Industrial Revolution, whereby the country sought to reduce reliance on oil and transform its economy to one based on knowledge, technology, and skilled labour. This entailed strengthening the country’s position as a global hub for 4IR technologies and innovation. Despite this exponential growth, as of 2021, the UAE placed 11th for overall connectivity in our study compared to other countries, alongside experiencing a GDP per capita decline of -$2,550.41.
In the second position, is Czechia. The country saw substantial growth in connectivity, increasing from 65.7 points in 2014 to 84.5 in 2021, a total of 18.8 points, resulting in a placing of 12th in overall connectivity as of 2021. Nonetheless, GDP per capita actually increased by $6930.33 during this time period, from $19,890.92 to $26,821.25. One of the key trends demonstrated in this study is that even countries that placed lower on the list for overall connectivity in 2021, still saw increases in GDP per capita. In some cases, this also aligned with sharp increases in the country’s connectivity. The country ranked as a leader across all four enablers, ranking highest on infrastructure (91.1) and lowest on affordability (78.7), showing that perhaps while the country is increasing in connectivity, this is not yet an affordable solution for all citizens.
Ireland ranked in third position for connectivity growth, increasing 18.2 points, from 70.4 to 88.6 between 2014 and 2021. Interestingly, this coincided with a $44,529 increase in GDP per capita overall, far surpassing any of the countries in our study regarding GDP increase. Irish companies have been heavily investing in 5G infrastructure and delivery, which has in turn proliferated usage of technologies advancing different aspects of society, such as remote health delivery. They have also been working on an O-RAN system that utilises 5G radio units to bring wireless broadband connectivity to rural areas, and allows smart cities to control traffic flow. Not only does this have a massive impact on daily life and connectivity for citizens, but also within key industries such as agriculture, where the combination of 5G and IoT technology has enabled farmers to collect expedited data on soil moisture and crop health to optimise irrigation and fertilisation.
Germany sits in fourth position with a respectable 17.1 point growth during the time studied. Increasing from 71.9 points in 2014 to 89 in 2021, contributing to being fifth in overall connectivity score as of 2021. As one of the leading European countries when it comes to IoT adoption and connectivity, Germany has seen direct growth in the manufacturing, home, health, and finance sectors as a result, as well as the retail and agriculture industries. However, the shortage of skilled specialists continues to drive outsourcing demand. This contributed to a $3,179 increase in GDP per capita over the years listed. GDP per capita can be impacted by a range of factors, with unexpected events like natural disasters and war (even when they occur outside of your country) having a massive impact. This shows how countries cannot solely rely upon improved technological innovation to bridge the gap.
And in the fifth position, is Hungary. The country saw a 14.5-point growth over the years, however, there’s still a way to go considering the country ranked 15th in our study for overall connectivity as of 2021. Nonetheless, they saw a $4,433.86 growth in GDP per capita. The index that we studied shows that the country ranked highest out of the four enablers for infrastructure (85.5), and lowest for affordability (78.1) Later data supports this, as of 2022, 1.06 million people did not use the internet, however, investments were still made in the service provided to existing customers, with the median mobile internet connection speed increasing 15.8 percent in the twelve months to the start of 2022.
Which countries came out on top for overall connectivity in 2021?
Singapore came out on top for overall connectivity in the countries that we studied, with a score of 91.4 points, and a $15,231.47 increase in GDP per capita. The country is the first in the world to be fully covered by standalone 5G, offering high-performance services for everyday users, as well as significant opportunities for applications within industries and enterprises. The government has earmarked 18.1 billion US dollars in R&D funding until 2025 to drive transformative technologies supporting efforts to maximise the benefits of digitalisation. The country benefits from a strong economy that regularly features in the global highest GDP per capita thanks to its pro-business views and low tax rates. The investments into connectivity also wield the power to supercharge existing businesses on the global front.
In the second position, is Finland with an overall score of 90.2 points in 2021. While they only saw a 10.6-point growth between 2014 and 2021, they saw a GDP per capita increase of $3,327.51. The country was the first to make internet access a legal right in July 2010, however, this early adoption means that there has been less significant adoption in later years. Their key economic sector is manufacturing, with the high-technology manufacturing sector ranking second largest in the world, after Ireland in 2004.
Norway placed in third position with an overall connectivity score of 89.9. Despite seeing an 11.6-point growth between 2014 and 2021, GDP per capita has actually declined by $7,864.90. The country has been regularly mentioned as one of the most extensively digitalised in the European region, with marked advancements in areas of digital infrastructure, digital public services and digital skills, and they recognise 5G as an enabler for further IoT and AI technology. According to data from Heritage, the country saw an economic slowdown in the years studied, which can be attributed in part to Covid-19, this then began to recover in 2021.
Not all countries that saw growth in connectivity saw a comparable growth in GDP per capita and vice versa. When we look at the comparison between the UK and Lithuania, both countries saw very similar growth between 2014 and 2021, with the UK increasing by 13.4 points and Lithuania increasing by 13.5 points. The UK had a much higher overall connectivity score in 2021 (89), placing joining fifth with Germany, however, Lithuania was placed towards the end of the list (81.3). GDP per capita in Lithuania increased by $7,172.32, whereas the UK actually decreased by $937.31.
Some have cited the reason for the discrepancy in the United Kingdom’s connectivity growth as being national deindustrialisation, with certain roles utilising automation less and less as connectivity has increased, and chronic underinvestment as a result of austerity. For example, economy commentator Duncan Weldon cited the example of car washes, “between 2003 and 2018, the number of automatic-roller car washes declined by 50%, while the number of hand car washes increased by 50%.” This is not an isolated case, as there have been numerous instances of people essentially doing jobs that could be automated, resulting in declining rates of worker productivity, and essentially a lower GDP per capita.
Overall, the results of this study have shown that increasing connectivity has contributed to increased GDP per capita in circumstances where national investment has been with the intention of improving workplace productivity and technological advancement for growing enterprises. We’ve also seen significant increases in GDP per capita in countries that don’t rank as highly overall for connectivity but have seen stark growth between the years 2014 and 2021. However, there is still work to be done to close the gap between countries that are emerging and improving, and those that are advancing and thriving. Those countries that have been early adopters of advanced connectivity and digitalisation, have also had the ability to implement this technology when it comes to domestic and social use, as well as enterprises. Whereas, countries that are only beginning to see the impact of improved connectivity, do not yet have the systems in place to apply this within the enterprise sphere. As a result, worker productivity levels have not yet reached their potential due to the systems and infrastructure being relatively new.
Methodology
We studied the difference in country based mobile connectivity rankings between 2014 and 2021 according to the GSMA Connected Society- Mobile Connectivity Index, comparing this with GDP per capita growth between the same time-period as reported by the World Bank.


