


As traditional energy sources like oil and gas continue to dwindle, and governments around the globe are waking up to the realities of the impact of these fuel sources, alternative forms of energy are becoming ever more important. With various renewable power sources becoming more readily available and alternative energy sources like nuclear energy offering low-carbon emission energy production, a global push on reaching net zero targets is underway. This global energy transition will be fundamental to reducing carbon emissions and creating an energy source that is clean and viable. However, the infrastructure and capacity need to be there to efficiently harness renewables.
Fuels are the largest contributor to global climate change, responsible for over 75 percent of global greenhouse gas emissions and nearly 90 percent of all carbon dioxide emissions, resulting in renewable energy being the key to the rapidly evolving problem.
As such, Distrelec wanted to examine the current state of energy globally, looking at the countries that are meeting or almost meeting their electricity needs by way of alternative energy, the landscape of the countries that are producing the highest amounts of energy in terms of billion-kilowatt hours, and the countries with the highest growth in wind power across countries with the highest units of production. This offers a glance at what the current state of alternative energy is like globally and within Europe. It’s important to note that we’ve conducted this analysis based on traditional renewable forms, as well as low-carbon alternatives such as nuclear energy. The finite nature of nuclear energy means that it cannot be classed as renewable, however, in the interest of preserving the environment, many European and international regions have turned to the resource as a form of low-carbon energy production.
An Alternative Energy Future?: Consumption vs Production
There are several countries that have met, surpassed, or almost met their energy needs based on data from 2020. These are detailed in the following graphic, and some have even seen significant growth since 2010, where they were already performing high in comparison with other countries we studied.
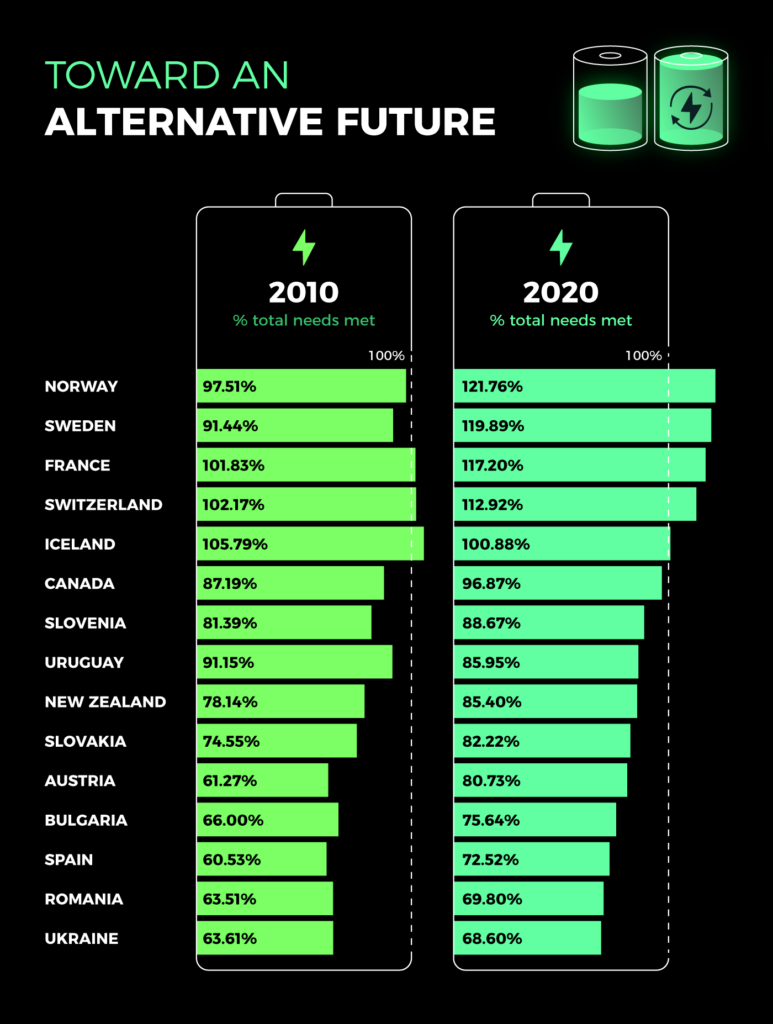
As anticipated, several Nordic countries have already surpassed their needs based on the data we analysed that shows how much was consumed versus how much was produced. Norway came out on top with a rate of 121.76%. Similarly, Sweden saw a 119.89% production rate for 2020, and Iceland saw a 100.88% rate, whereas other Nordic regions such as Finland saw a 57.99% rate and Denmark saw just below 50% with a 49.51% rate. Compared to the Nordic regions leading the way, these rates are almost half less. Norway, Sweden, and Iceland are all heavily reliant on hydroelectricity, whereas Denmark produced more via wind power, and Finland produced the most electricity through nuclear sources.
France came in third position, having produced 117.20% of the electricity it consumed in 2020, reaching this goal primarily through nuclear power production, and the rest split across various sources such as wind, hydroelectricity, solar and geothermal. Also placing within the top 5 was Switzerland, producing 112.92% of the equivalent amount of electricity they consumed in 2020 via alternative resources. 59.61% of this was obtained via hydroelectricity and 36.19% via nuclear power.
Canada placed within the top 10, in sixth position, with higher consumption than any of the aforementioned countries at 532.71 billion kilowatt hours, and production rates at 516.03 billion kWh which was the equivalent of 96.87%. This is primarily made up of hydroelectricity at 74.22% followed by nuclear.
Meanwhile, the USA placed much lower, likely due to the extremely high consumption rates due to the size of the country. In 2020, 3897.89 billion kilowatt hours of electricity were used, second only to China’s 6801.39 billion kilowatt hours. The US fulfilled 40.01% of its consumption needs via low-carbon sources, primarily via nuclear power, followed by wind and hydroelectricity. China fulfilled 36.21% of its consumption needs through non-traditional energy sources, producing 2462.53 billion kilowatt hours of electricity in 2020. 55.03% of this was via hydroelectricity, followed by wind and nuclear.
The UK placed outside of the top 10, in 25th position, below fellow European nations such as Germany, as well as international players such as New Zealand, albeit having a higher rate of consumption than some of the better-performing international countries. In 2020, the UK used 295.05 billion kilowatt hours of electricity, and produced 141.72 via alternative sources, resulting in 48.03% of the electricity used being produced in equivalent renewable sources. 53.5% of this portion was as a result of the developing wind industry, and the UK is home to seven out of the world’s ten largest offshore sites, with the upcoming Dogger Bank project set to be the largest.
The EU has recently been negotiating a renewable energy law that will see a legally-binding target of raising the share of renewable energy in the EU’s overall energy consumption to 42.5% by 2030, which currently stands at 22.1% according to EU statistics. Originally, legislation was causing concern for countries like France over the EU-wide targets on renewable hydrogen, which would conflict with the production of low-carbon hydrogen derived from nuclear energy. The French Minister for Energy Transition has since declared that the country is happy with the changes to the agreement as it recognises the role of nuclear power in achieving decarbonisation goals. The agreement will now need to proceed through the European Parliament.
The Countries Producing the Highest Amounts of Electricity, Where Is It Obtained?
As our study has shown, different countries have different consumption needs and varying abilities to fulfill them through up-and-coming energy sources. Depending on the region they are located in, these countries also vary in where they obtain this energy, as depicted by the following graphic. We examined the countries producing the highest amount of energy from renewable sources, based on overall units (billion kWh) as opposed to what extent they meet their consumption needs.
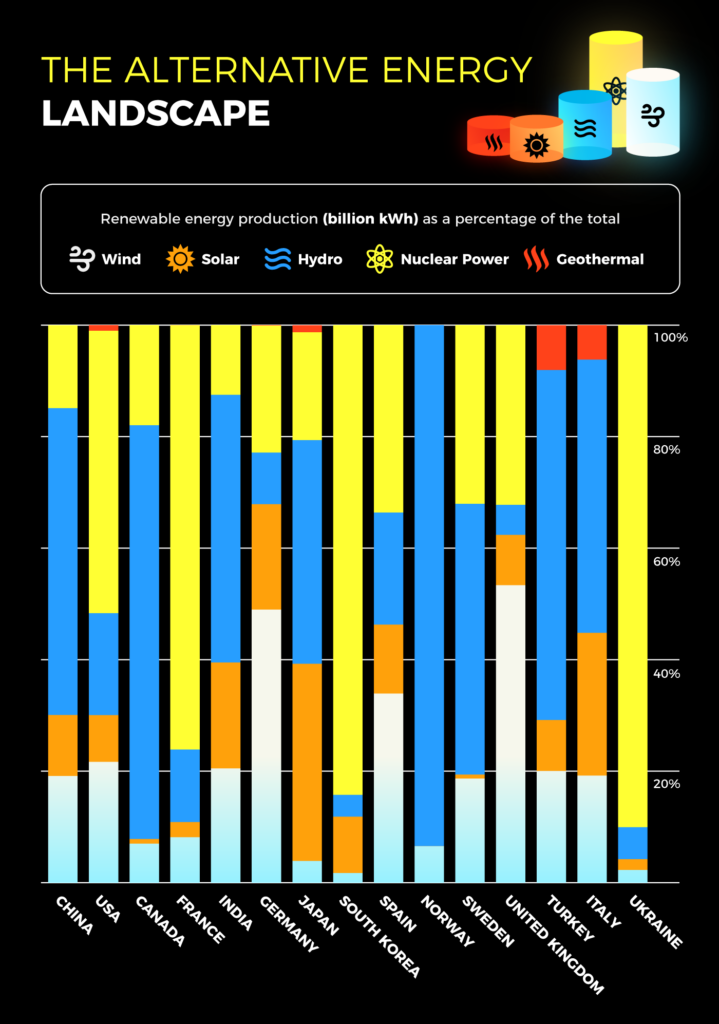
The country generating the highest percentage of renewable energy via solar power is Japan, with 35.37% of electricity produced coming from solar power, producing 78.64 billion kilowatt hours of energy. When ranked by units produced, Japan places third, below China and the US which produce 269.72 billion kWh and 130.72 billion kWh respectively.
When it came to hydroelectricity, the country obtaining most of its energy from the source was Norway with 93.44% being derived from it.
The countries relying the most on nuclear energy as an alternative energy resource were Ukraine and South Korea, with 90.05% of Ukraine’s alternative energy being generated via the resource (76.2 billion kWh) and 84.24% of South Korea’s (152.33 kWh).
Geothermal appeared to be the least utilised form of renewable energy, with Turkey relying on the source the most according to our data. A total of 8.05% of their overall renewable energy was generated via the source in 2020, the equivalent of 9.93 billion kilowatt hours.
Meanwhile, the country obtaining the highest percentage of energy via wind power amongst the above countries is the UK, with 53.5% of their electricity production coming from turbines, however, if we look at units produced, the UK ranks fourth, with China in first position, followed by the US and Germany. China produces 471.18 billion kilowatt hours of electricity through wind power, while the UK produces 75.61 billion kWh.
The current largest source of renewable power globally is hydropower, with wind power coming in second. In addition, the cheapest source of renewable energy is solar power, closely followed by wind. Wind has significant potential as a renewable energy source, and as we approach a need to develop viable and cost-effective sources, we wanted to look into the areas that have seen the greatest growth in wind production.
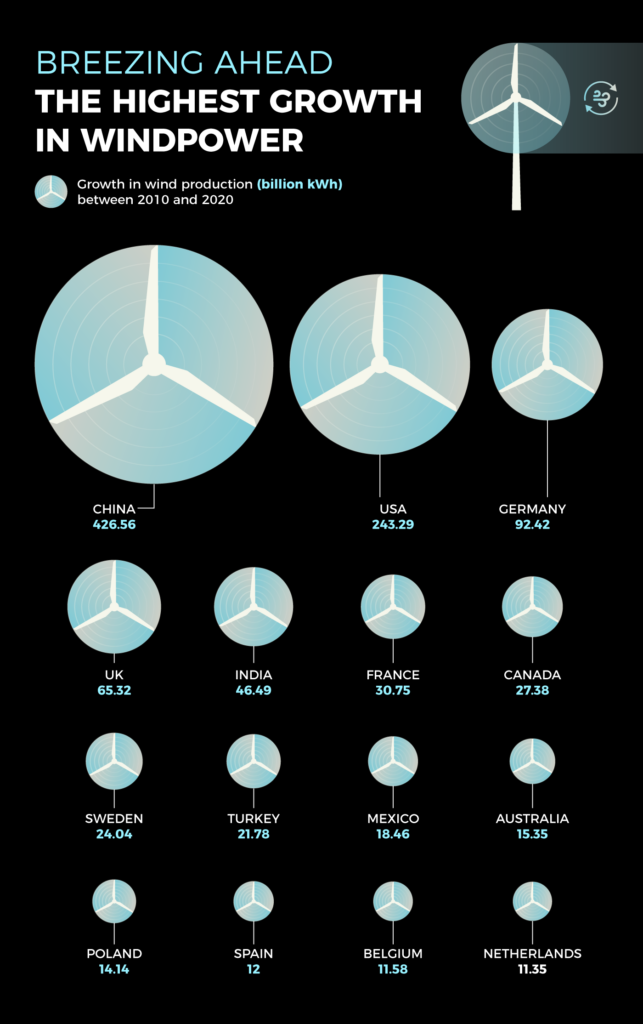
China ultimately came out on top for windpower growth, with 426.56 billion kilowatt hours of energy being produced by the renewable energy source. This is mostly due to aggressive decarbonisation targets in China and a fast-growing offshore wind sector.
This was followed by the USA which achieved just over half of what China produced in 2020, with 243.29 billion kilowatts. Again with less than half of what its predecessor produced was Germany, with 92.42 billion kilowatt hours of energy produced in 2020.
The wind industry is expected to see rapid growth, with the Global Wind Energy Council forecasting that onshore and offshore wind turbines capable of generating 680 gigawatts of wind power will be installed by 2027. This capacity is estimated to be enough to power around 657 million homes per year.
Although this development is promising, there are also several constraints with regards to ongoing development. For example, McKinsey highlighted Germany’s race to identify new potential sites, and while 51 percent of the country’s land is potentially suitable for onshore wind farms, regulatory, environmental, and technical constraints eliminate all but 9 percent.
Ultimately, alternative energy is gaining ground fast. The International Renewable Energy Agency (IRENA) estimates that 90 percent of the world’s electricity can and should come from renewable sources by 2050, and with european and international governments taking a rigorous approach to decarbonisation strategy, experts see the developments within areas like the wind industry as being positive. The benefits also don’t end at reducing overall global warming, it also has an impact on air pollution and the general health of global populations, as well as reducing the monopoly that fossil fuel exporters have over the 6 billion people globally who are dependent on them. According to the UN, renewables offer a way out of this dependency that makes certain countries and people vulnerable to geopolitical shocks and crises, allowing countries to diversify their economies and drive economic growth, while simultaneously generating new jobs.
———————————————————————————————–
Methodology
We utilised data from theglobaleconomy.com to calculate the countries with the highest overall production rates, what this consists of in terms of power source ie. wind, nuclear, hydroelectricity, and how this has changed over the decade of 2010-20.
We then calculated country consumption of electricity in billion kWh and compared this with the total output of renewable energy sources within the same given period to calculate to what extent the country is moving toward renewable and alternative energy reliance.


