


European climate anxiety has undoubtedly skyrocketed after an intense summer of record-breaking temperatures in most areas. Policy strategists and decision-makers have been addressing the climate crisis across the board, urgently working to implement the actions set out during COP26 and develop a multilateral climate approach.
Transport constitutes a large proportion of emissions in Europe, with road transport contributing the highest proportion of overall transport emissions. In 2019 it emitted 72% of all domestic and international transport GHG, and by focusing on road transport as a sector, countries can decarbonise quicker than focusing on compelling private companies in sectors like aviation to consider their carbon impact.
With this in mind, Distrelec analysed a number of European countries and their capitals to calculate which has the transport system that lends itself to sustainability, and which has areas that still need improvement.
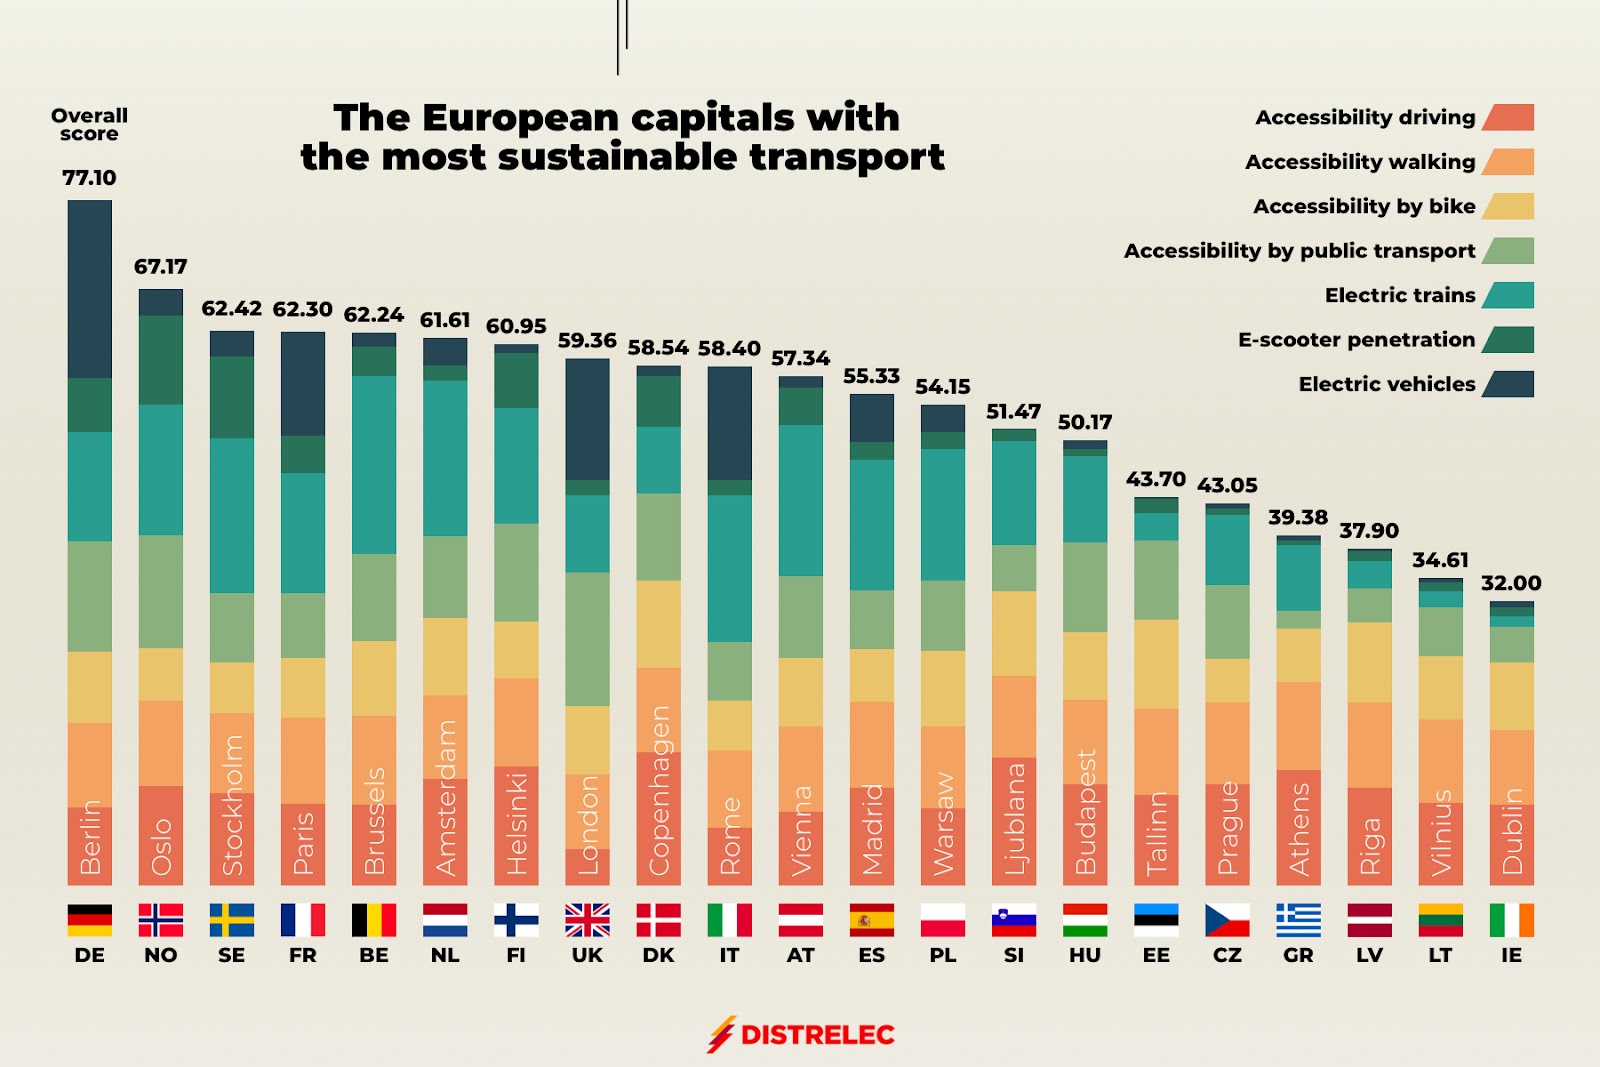
We analysed these countries across several factors based on urban access and mobility, as well as how sustainable these modes of transport actually were. As a result, the most important factors were the number of electric vehicles and the percentage of train lines electrified, followed by accessibility within the city via driving and public transport. Other factors that had an impact were accessibility via foot and bike, as well as e-scooter penetration. With road transport being one of the greatest carbon emitters, electric vehicles were a key metric in determining sustainability.
Accessibility via driving is important, but so is the vehicle used to achieve this. The same thinking was applied to public transport, focusing on trains as these are regularly used for commutes and long-distance journeys. We then considered walking, biking and e-scooters as these are often options that natives and tourists alike use to navigate inner-city areas.
Claiming the highest score for sustainable transport was Berlin, Germany. It’s hardly surprising that they scored highly when it came to urban mobility via public transport, the capital has a sophisticated and affordable network comprising U-Bahn trains, S Bahn, and buses that take locals and travellers across the city. And for those preferring to travel solo, Germany also scored highly for their number of electric vehicles as well as accessibility when it came to walking.
In the second position was Oslo, Norway. The country has ambitious plans when it comes to sustainable transport, particularly due to the fact that the transport sector accounts for almost one third of Norway’s greenhouse gas emissions. Their national transport plan outlines the steps that will be taken between 2022-2033 to reach these goals, however, the capital already scored the highest for e-scooter penetration and highly for public transport accessibility and driving accessibility. They also scored well for the percentage of train lines electrified and the percentage of electric vehicles, a particularly important factor considering the country aims to have all new passenger cars and light vans as zero-emission vehicles by 2025, as well as city buses which will be zero-emission or use biogas.
In third place was Stockholm, Sweden, a city which aims to provide the most sustainable public transport in the world. Their public transport system (SL) consists of about 450 bus lines, three shuttle boat lines and a metro system, in addition to other trams and local trains. Public transport in Stockholm has been running on 100% renewable energy since 2017 when it comes to the metro, buses and local trains. As such, the city ranked highly for electric trains and public transport, in addition to e-scooter penetration. However, when it came to the sustainability of personal vehicles, the capital ranked below average for percentages of electric vehicles, which would perhaps be an area for improvement going forwards. Stockholm didn’t rank so highly for accessibility by foot and bike, however the intricate, and sustainable public transport system mitigates this.
While e-scooter penetration is high in the Nordic regions, there have also been numerous difficulties with adapting road infrastructure to accommodate them. As of August 2022, Stockholm began to clamp down on e-scooter usage, with a ban on riding e-scooters on public pathways and increasing restrictions around where they can be parked. With many people using e-scooters for ‘last mile’ journeys after public transport, or even last minute journeys when in a rush, it’s currently unclear how this will have an effect going forward.
While urban mobility via driving was low for Paris, France, the capital still came in fourth position due to its strengths in other areas. Particularly, the percentage of electric vehicles on the roads, the percentage of trains that had been electrified, and urban mobility access via foot. Despite the renowned ‘Vélib’ service that was introduced in 2007, the city scored below average for accessibility via bike in comparison to other European capitals. It also scored below average for public transport accessibility, and while the city aims to have all its buses running 100% ecologically by 2025, there is potentially some way to go in ensuring that the infrastructure facilitates mobility.
Dublin, Ireland came last with an overall score of 32, scoring significantly below average on every factor except accessibility via biking. The Greater Dublin area transport strategy 2022-2042 seeks to improve this by building upon existing developments such as rail infrastructure, the rollout of new cycle tracks and greenways, as well as investment in bus priority and bus service improvements.
——————————————————————————————————————————-
Methodology
We used the OECD urban access framework to gather information on urban mobility for each of the core modes of transport: driving, walking, cycling and using public transport for each of the major European capitals. Driving and use of public transport were weighted at 15 due to their impact on carbon emissions when compared with walking and cycling (10). This data looked at a scale of the city (core) at a distance of 15 minutes/4km (1km for walk) to ‘population’ as a destination.
We then used data from ACEA to calculate the percentage of new passenger car registrations in the EU by alternative fuel type, adding together all alternatively-powered vehicles for the ‘electric vehicles’ statistics. This was valued at 20.
We then used data from Statista to calculate E-scooter penetration in each country as of 2022, as well as the railway lines electrified by country, 2019. E-scooter penetration was valued at the lower level of 10, whereas electric railway lines were valued at 20.


